


Malnutrition = deficiencies, excesses, OR imbalances in energy/nutrients. WHO estimates 1.9B overweight + 462M underweight adults globally. Not just “starving”—double burden kills 9M annually via NCDs + infections.
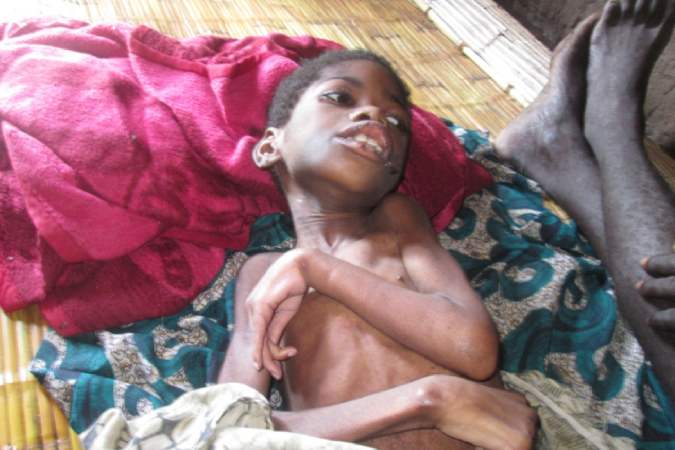
Whenever we consider the issue of malnutrition the first thing which crosses the mind is the absence of food and hunger. The images that are bound to be developed and created are those of weak children who hardly stand on their feet. The images tend to make the rounds of the world in the event of a nutritional crisis which already took place in Ethiopia, Somalia or in the Horn of Africa. The number of malnourished children in the globe today has exceeded 200 million. Yet a more complicated process causes malnutrition, which causes the death of approximately 7,000 children on a daily basis.
Table of Contents
WHO Classification (3 Main Types)
| Type | Definition | Prevalence | Key Indicators |
| Undernutrition | Insufficient calories/protein | 462M adults | Wasting, stunting, underweight |
| Micronutrient | Vitamin/mineral deficiency | 2B people | Anemia, goiter, night blindness |
| Overnutrition | Excess calories/fat | 1.9B overweight | Obesity, diabetes, hypertension |
4 Core Undernutrition Forms (Children)
1. WASTING (Low weight-for-height): Acute malnutrition
- Mortality: 10-20x higher
- Causes: Famine, diarrhea outbreaks
- Global: 45M children (2025)
2. STUNTING (Low height-for-age): Chronic
- 149M children <5 years
- Irreversible brain damage
- 20% lower IQ permanently
3. UNDERWEIGHT (Low weight-for-age): Mixed
- 390M total cases
- Overlaps wasting + stunting
4. MICRONUTRIENT DEFICIENCIES (“Hidden Hunger”)
- Iron: 1.92B anemic women
- Vitamin A: 257K blindness cases/yr
- Iodine: 1.9B IQ loss globally
Who does Malnutrition Affect?
Malnutrition hits the most vulnerable hardest—children under 5, pregnant women, elderly, and conflict zones bear 90% of the global burden.
Primary Affected Groups (2025-2026 Data)
| Group | Prevalence | Impact | Hotspots |
| Children <5 | 149M stunted (22%) | IQ -15 points permanent | Sub-Saharan Africa (40%), South Asia (35%) |
| Pregnant Women | 30M anemic globally | 830K maternal deaths | India (27M), Nigeria (6M), Pakistan |
| Elderly (>65) | 1 in 3 hospitalized | Sarcopenia + 2x fall risk | Europe (aging), India (elder neglect) |
| Refugees/Conflict | 122M displaced | 10x wasting rates | Yemen (39.5%), Gaza, Sudan |
Geographic Hotspots (Top 15 Countries)
- Somalia: 51.3% undernourishment
- Haiti: 50.4%
- Madagascar: 39.7%
- Yemen: 39.5%
- Liberia: 38.4%
- Zimbabwe: 38.1%
- DR Congo: 37%
India: 13.7% (190M affected)—double burden of stunting + obesity.
Double Burden Paradox
| Region | Undernutrition | Overnutrition |
| India | 35% kids stunted | 40% adults overweight |
| Mexico | 13% underweight | 75% obesity |
| Egypt | 25% anemia | 35% diabetic |
Lifecycle Vulnerability Windows
INFANCY (0-12m): 50% stunting occurs
PREGNANCY: Anemia → low birth weight
ELDERLY: 30% calorie needs drop → sarcopenia
CRISIS: Refugees 7x acute malnutrition
Economic Vulnerability
Day Laborers: Income → food gap
Female-Headed: 25% higher risk
Landless Farmers: Climate → 40% crop loss
Urban Slums: Street food → micronutrient gap
Silent Reality: 783M chronically hungry + 2.4B moderately food insecure = 3.2B (40% world population) malnutrition exposed. Children lose decades of productivity, mothers lose lives, economies lose $3.5T GDP annually.
Most at Risk: Toddlers in Somalia, pregnant women in India, grandparents in nursing homes. Prevention = nutrition + sanitation + income triple intervention.
Macronutrient vs Micronutrient Breakdown
| Nutrient | Deficiency | Excess | Consequences |
| Protein | Kwashiorkor (edema, fatty liver) | Kidney strain | Muscle wasting vs obesity |
| Carbs/Fat | Marasmus (total wasting) | NAFLD, T2D | Starvation vs metabolic syndrome |
| Vitamins | A: Blindness D: Rickets |
Hypervitaminosis | Night blindness vs kidney stones |
| Minerals | Iron: Anemia Iodine: Goiter |
Fluorosis | Fatigue vs bone damage |
Root Causes Hierarchy (2026 Data)
PRIMARY (60%): Food insecurity
- 783M hungry (chronic)
- 2.4B moderate food-insecure
SECONDARY (25%): Disease absorption barriers
- Diarrhea: 1.7B cases/yr destroys gut
- HIV/TB: 10M new cases suppress appetite
- Malaria: 249M cases (2025)
TERTIARY (15%): Access + Knowledge
- Poor sanitation (3.5B lack toilets)
- Cultural taboos (meat avoidance)
- Ultra-processed dominance (60% calories)
Global Burden Pie Chart (Deaths/Year)
Children <5: 45%
Adults NCDs: 30%
Infectious: 20%
Elderly: 5%
High-Risk Groups (Prevalence)
| Group | Risk Factor | Stats |
| Children <5 | 149M stunted | Brain irreversible |
| Pregnant Women | 30M anemic | 830K maternal deaths |
| Elderly | 1 in 3 | Sarcopenia + falls |
| Developing Nations | 69% burden | Sub-Saharan + South Asia |
| Obese + Poor | “Double burden” | 2B overweight + micronutrient gaps |
Economic Cost (2026 Projections)
GDP Loss: $3.5T annually (12%)
Healthcare: $1.2T direct costs
Productivity: $2.3T (stunting IQ loss)
India Alone: $15.6B/yr (4.5% GDP)
Symptoms Matrix (Early vs Advanced)
| System | Early Warning | Advanced Damage |
| Skin/Hair | Dry, brittle hair | Flag sign, alopecia |
| Eyes | Night blindness | Keratomalacia (blind) |
| GI | Constipation | Edema, ascites |
| Neuro | Irritability | IQ -15 points permanent |
| Immune | Frequent colds | 10x mortality risk |
Actionable: Fortified rice (India model) cuts anemia 20%. Lipid supplements reverse 70% wasting. Double burden demands calorie + nutrient interventions simultaneously.
Conclusion
Malnutrition = silent GDP killer. Undernutrition shrinks brains/economies. Overnutrition crashes healthcare. Integrated policies (food + sanitation + education) = only scalable fix.